7.30.2012

ADDIE 3.0

ADDIE 3.0


After seeing the title you might be wondering, “I didn't even know we had an ADDIE 2.0???”

When the first version of ADDIE appeared in 1975 it was strictly a linear or waterfall method. The first four phases (analysis, design, development, and implementation) were to be performed in a sequential manner. This is a good method if you are trying to prove something in that it helps to ensure that all the variables are accounted for. However, the majority of learning designers simply want to build a great learning process, and for that a more dynamic method is required that allows them to change and improve the learning process as they advance through their designs. Learning designers who were not locked in to processes improved upon ADDIE by making it an iterative model. Thus by the mid-eighties ADDIE became a dynamic model (U.S. Army, 1984).

As van Merriënboer notes, “The phases may be listed in a linear order, but in fact are highly interrelated and typically not performed in a linear but in an iterative and cyclic fashion.” This major improvement became ADDIE 2.0 in that it allowed designers to work in a more natural fashion.

van Merriënboer (1997) also noted another major improvement—other components may be added to it on an as-needed-basis. This greatly improved the versatility of ADDIE in that while it is a broad scope model that covers the basics of good learning deign, it fails to cover many of the details. Thus rather than being a stand-alone model, it is used with other design models. Thus it became ADDIE 3.0 in that ADDIE is used to guide the essentials of the design, while other models are used in conjunction with it to expand and improve the design methodology:

ADDIE 3.0

Some example include:

  • Analysis - Complex problems can be difficult to identify by standing on the outside, thus you might need to jump into the problem itself. This is known as “Immersion” in Problem X Design. Another method is using narratives by having the customers tell stories of the problems they have faced. It often only takes a few stories to recognize a common theme that prevents them from higher levels of performance. This technique is used in System Thinking Design.
  • Design - The 4C/ID model shows two basic approaches for presenting content and two basic learning strategies that gives us four instructional design methods that vastly improves upon the common method of simply presenting content to the learners.
  • Development - Using backwards planning with Concept or Action Mapping to keep the goals of the learning process aligned with the business objectives.
  • Implementation - Always consider other performance methods, such as performance aids, before deciding upon classroom learning.
  • Evaluation - Flipping the Four Levels of Evaluation into a more effective model.

5.20.2012

Updated Table of Five Design Models


A collection of design models


I recently added a new row to the table of design methodologies that shows some examples after a request from a reader: A Table of Design Models: Instructional, Thinking, Agile, System, or X Problems?


I would be interested to know if the examples are helpful.

5.14.2012

A Table of Design Methodologies: Instructional, Thinking, Agile, System, or X Problems?


A collection of design models
With so many design models to choose from, what should I use? To help with the answer I created a table of five design methodologies that may assist you in choosing a model to start from:
  • Instructional System Design
  • Design Thinking
  • Agile Design
  • System Thinking
  • X Problems
The table includes their definitions, visual models, primary focus and goals, values, main steps, and further readings (web links). Note that models are only guides on the sides, not sages on the stages, so don't hesitate to mix, match and adapt to help you arrive at a perfect solution to a difficult problem.
Let me know what you think.

4.18.2012

Mapping Pedagogies For Performance

Clark Quinn wrote an extremely interesting post, X-based learning: sorting out pedagogies and design, on activity based learning. Wanting to see how these different models would interconnect on a mindmap, I started playing with them. That is when I noticed that one of the main difference among them is that some have a known answer and/or the goal is driven by the curriculum, while others have an unknown answer and/or the goal is directed by the learners.

It then struck me that the two primary branches should (could?) be the two main types of knowledge—explicit and tacit:

  • Explicit Knowledge is normally easy to articulate to others, thus the models with known answers and/or driven by the curriculum would fall on this side of the branch.
  • Tacit Knowledge is normally difficult to articulate to others, thus the models with unknown goals and/or directed by the learners would fall on this side of the branch.

This seemed to give the mindmap a real purpose, rather than just be formal vs. informal, social vs. self, or active vs. passive. Thus the map goes beyond activity based models:

Pedagogy Mindmap

For a larger map click on the image or here.

(note that you can hover your mouse pointer over each concept in the large map to learn more about it)

I'm not sure if I have all the concepts aligned correctly, thus I am wondering what your thoughts are?

Note: I used FreeMind (free of course) to create the mindmap. The document for the mindmap is here - Learning.mm - if you want to download it and revise it. If you have trouble downing it, this is the directory of all the files used to create the mindmap, pictures, and html file - http://nwlink.com/~donclark/learning/pedagogies/. Right click on the file you want to download.

3.23.2012

ADDIE is the Scavenger of Instructional Design, Not the Bitch Goddess (or Blooming Beyond Bloom)

When ADDIE was first handed over to the U.S. Armed Forces it was a linear model. However, after working with it they found that they needed a more dynamic model, so they adapted it. They mastered the tool rather than become a slave to it.

For some reason instructional designers love building ADDIE into a goddess that orders them to build crappy learning platforms. For example, they pronounce that it only builds courses when the real fact is that it tells you to use a course only if a simpler method, such as a performance support tool or OJT, will not work.

From its inception, ADDIE was designed to be a lean, mean, instructional design machine. This leanness has fooled others into thinking that it is a universal model that can build strip malls and skyscrapers. Nope! ADDIE has specific steps that are strictly designed for learning. This has led others to believe that ADDIE is too lean, that it tells them what to do, but not how to to it. But as Merriënboer noted, you can add other components on to it when needed

ADDIE is a Scavenger, not a Hoarder

One of the learning tools that is perhaps most often plugged into ADDIE is Bloom's Taxonomy. And of course one of the criticisms often leveled at ADDIE is that it is associated with outdated learning models. However, this plug and play feature of ADDIE does not mean it hangs on to outdated models, but rather it sheds them and goes scavenging for a better one. While Bloom's Taxonomy has been quite useful in that it has extended learning from simply remembering to more complex cognitive structures, such as analyzing and evaluating, newer models have come along.

There are at least three suitable replacements:

1. Revised Bloom's Taxonomy

In the mid-nineties, Bloom's taxonomy was updated to reflect a more active form of thinking and is perhaps more accurate (Anderson, Krathwohl, 2001):

Bloom's Taxonomy

This is perhaps the easiest replacement since it is closely related to the original taxonomy, thus most designers will rapidly adapt to it.. What is interesting about the updated version is how it resembles the SOLO Taxonomy (Structure of Observed Learning Outcomes):

2. SOLO Taxonomy

SOLO Taxonomy

The SOLO taxonomy is a means of classifying learning outcomes in terms of their complexity in order to assess students' work in terms of quality (see http://edorigami.edublogs.org/2010/07/17/solo-taxonomy/)

3. Marzano's New Taxonomy

In The Need for a Revision of Bloom’s Taxonomy, Marzano describes six levels:

  • Level 6: Self-system
  • Level 5: Metacognitive System
  • Level 4: Knowledge Utilization (Cognitive System)
  • Level 3: Analysis (Cognitive System)
  • Level 2: Comprehension (Cognitive System)
  • Level 1: Retrieval (Cognitive System)

It is made up of three systems and the Knowledge Domain. The three systems are the Self-System, the Metacognitive System, and the Cognitive System. When faced with the option of starting a new task, the Self-System decides whether to continue the current behavior or engage in the new activity; the Metacognitive System sets goals and keeps track of how well they are being achieved; the Cognitive System processes all the necessary information, and the Knowledge Domain provides the content (see ftp://download.intel.com/education/Common/in/Resources/DEP/skills/marzano.pdf.).

What are your replacements for Bloom's Taxonomy?

Reference

Anderson, L.W., and Krathwohl, D.R., eds. (2001). A Taxonomy for Learning, Teaching, and Assessing: A Revision of Bloom's Taxonomy of Educational Objectives. New York: Longman.

3.07.2012

The Mosaic of Learning Styles

Yes I'm a few days late for David Kelly’s Learning Styles ‘Awareness’ Day, so I hope you forgive me. While most of the recent posts on using learning styles in instructional design have been mainly against using them, I'm going to take a slightly different position—not that we need to cater to each individual style, but that learning styles may be helpful when designing learning platforms.

So far the learning style debate has been mostly two tiles of a different color laid side by side—you are either fer it or agin it—we should assess student learning styles to improve learner outcome verses learning style assessments are unreliable, thus they should not never be used. However, I see the debate more as a mosaic that allows multiple patterns to occur.

Sensing and Intuitive Learning Styles

Perhaps the most critical study on learning styles is Coffield, Moseley, Hall, and Ecclestone's Learning styles and pedagogy in post-16 learning: A systematic and critical review. While the authors mostly found that matching the form of instruction to individual learning styles did not improve learning, there are some interesting exceptions throughout their paper, for example, on page 67 they write:

“More positively still, Katz (1990) in a quasi-experimental study of 44 occupational therapy students in the US and 50 in Israel, hypothesised that students whose learning styles matched the teaching method would perform better (ie more effectively) and would need less time to study outside class (ie more efficiently). The findings in both countries supported the premise that ‘the better the match is between students' individual characteristics and instructional components, the more effective or efficient the learning program is’ (Katz 1990, 233). But even this conclusion needed to be qualified as it applied only to higher-order cognitive outcomes and not to basic knowledge.”

So in search of a good paper on using learning styles in higher order cognitive skills I came across this paper, An Investigation into the Learning Styles and Self-Regulated Learning Strategies for Computer Science Students, by Alharbi, Paul, Henskens, and Hannaford. For their study they use the Felder-Silverman Learning Style model that uses four dimensions:

  • Perception (Sensing or Intuitive) describes the ways in which learners tend to perceive information. Sensing learners prefer to learn facts, are comfortable with details, and tend to solve problems using well-established methods. Intuitive learners prefer abstract concepts, theories, and mathematical formulas, and seek innovation and new ideas when solving problems.
  • Input (Visual or Verbal) distinguishes between learners based on their preferred medium for the presentation of information. Visual learners prefer to learn using visual medium of presentations, such as pictures, charts, and diagrams. Verbal learners prefer spoken or written materials. Both types of learners benefit when material is delivered using a combination of visual, verbal, and written forms.
  • Processing (Active or Reflective) evaluates learners based on the way they process information. Active learners prefer to learn material by using it, whereas reflective learners prefer to think about how things work before actually trying them out. Active learners are typically more comfortable working in groups than reflective learners.
  • Understanding (Sequential or Global) looks at how users understand new information. Sequential learners like to follow a step-by-step linear approach that focuses on the connections between the different parts of the learning material. Global learners prefer to grasp the full picture before narrowing into the details.

The study was not about assessing the learners' styles and then catering to their preferred styles but rather assessing them on the above dimensions and then testing them on a core computer science course to see how each dimension performed. The author's correlation analysis showed that while three of the dimensions (Input, Processing, and Understanding) were not statistically significant; the Perception dimension had a significant impact on the students' results in the examination, with the t-tests confirming that sensing students were significantly outperformed by intuitive students.

The authors note that the majority of students in the study (65.8%) were sensing learners, with 39.5% having a moderate or strong preference to that learning style. However, 21.0% of students have a moderate or strong preference to intuitive learning over sensing learning. This suggests that there is a need for learning material for both types of learners, but the greater emphasis should be placed on reducing abstraction to better meet the requirements of the sensing learners, especially when it is seen that intuitive learners performed significantly better on the midterm examination.

While it was just one study, it did seem to follow the patterns of a couple of studies discussed in the Coffield et al. paper:

  • Woolhouse and Bayne (2000) noted that individual differences in the use of intuition are correlated with the sensing-intuitive dimension (p50)
  • Allinson and Hayes (1996) report that intuitive students performed significantly better than analytic students on the Watson-Glaser Critical Thinking Appraisal (p85)

The authors write that instructors often tend to use more intuitive type instructions (abstract concepts, theories, etc.), rather than the more sensing types of instruction (such as facts, details, and problem-solving methods). While this might at first seem laudable in that they are trying to teach the learners to operate in a more complex world that seeks innovation and new ideas when solving problem, learners often need a basic scaffold of facts and basic problem-solving methods. Yes, some of the learning platforms that we might be providing are for complex environments that do not have proven problem-solving methods, but the least we should do is provide them with some simple facts and heuristics. For example, branching scenarios are often used in elearning platforms but we expect them to jump right in and guess their way through the activity.

An example of this is that one of the myths in our profession is that ISD or ADDIE was only designed for classrooms and there is a lack of rules for when classroom training should be used (we use it more often than it is needed), but the Armed Forces came up with a simple heuristic back in the 1980s - ADDIE Does More Than Classrooms. Thus this heuristic should be given to learners studying to be instructional/learning designers BEFORE they attempt to do a branching scenario or similar activity.

The Continuum of Learning Styles

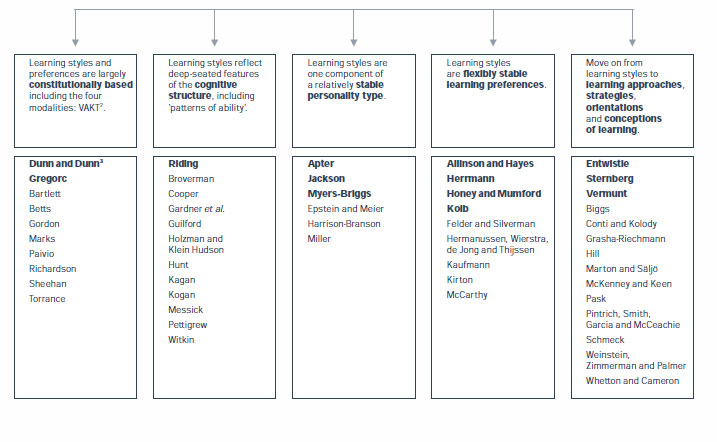
In the Coffield et al. paper they note that the various theories of learning styles can be placed on a continuum (pp 9-10) as shown in the chart below. The ones on the left are considered more constitutionally fixed styles (innate) while the ones to the right are considered more flexible:

The Continuum of Learning Styles
Click to bring up a larger chart in a new window

The Sensing and Intuitive learning styles discussed above fall on the right side of the continuum, thus depending upon the learner's knowledge and skills, the subject or task, and/or the type of instruction, a learner could fall on either the sensing or intuitive side of the dimension (however, from the studies noted in this post, the majority seem to fall on the sensing side).

One of the styles that fall strongly on the left side of the continuum is VAK (Visual, Auditory, and Kinesthetic), which poses a conundrum in learning styles.

The VAK Conundrum

In an interesting study, Visual Learners Convert Words to Pictures, functional magnetic resonance imaging (fMRI) technology was used to scan subjects' brains while they performed a novel psychological task involving pictures that could be easily named and words that could be easily imagined.  They found that the more strongly an individual identified with a visual cognitive style, the more they activated the visual cortex when reading words. Conversely, fMRI scans also showed that the more strongly an individual identified with a verbal cognitive style, the more activity they exhibited in a region of the brain associated with phonological cognition when faced with a picture.

Thus it seems our tendency to identify with being a visual or verbal learning is hardwired in us, however, visual preference does not always equal spatial aptitude (Ruth Clark & Chopeta Lyons, Graphics for Learning, 2004). Spatial aptitude is the ability to generate and retrain spatial images as well as transform images in ways that support visual reasoning.

Thus the conundrum—we may identify with being a visual or verbal learner (indeed, we may even be wired for one or the other), but it does not mean we are a good visual or verbal learner! Thus if we know what style our preference is, we need to think twice if we attempt to train others or learn something on our own if the learning method matches our style.

However, Clark and Lyons give us a few rules to follow:

1. Learners with low prior knowledge need graphics that are congruent with text (and preferably the text should be audio to prevent cognitive overload).

2. Learners with high prior knowledge need only words or visuals; not both, but one study did suggest that the diagram alone was best.

3. Encourage visual literacy. Some learners tend to view visuals as fluff, thus they tend to ignore them even though they might be their best means of learning. One method of encouraging their use is to use a visual and ask a question that can only be derived by examining the visual.

My Three Tiles in the Mosaic of Learning Styles

Sensing and Intuitive Learning Styles, The Continuum of Learning Styles, and The VAK Conundrum are my three tiles in the mosaic of learning styles. What are yours?

1.16.2012

Kirkpatrick's Revised Four Level Evaluation Model

I had an interesting discussion with Clark Quinn on using Kirkpatrick's model in learning processes other than courses. Clark argues that use of Kirkpatrick’s model is only for courses because training is the dominant discussion on their web site. I disagree and wonder if perhaps it is more of a “not invented here” hesitation because advancing concepts to the next level has often been a primary means of moving forward. It might sound good to forget an old model, but if you do not help people relearn, then their old concepts have a nasty habit of reappearing. In addition, training is far more than just courses. So after some heavy reflection I did a rewrite on my Kirkpatrick web page and have listed some of the highlights below.

More than Courses

While some mistakenly assume the four levels are only for training processes, the model can be used for other learning processes. For example, the Human Resource Development (HRD) profession is concerned with not only helping to develop formal learning, such as training, but other forms, such as informal learning, development, and education (Nadler, 1984). Their handbook, edited by one of the founders of HRD, Leonard Nadler, uses Kirkpatrick's four levels as one of their main evaluation models.

Kirkpatrick himself wrote, “These objectives [referring to his article] will be related to in-house classroom programs, one of the most common forms of training. Many of the principles and procedures applies to all kinds of training activities, such as performance review, participation in outside programs, programmed instruction, and the reading of selected books” (Craig, 1996, p294).

Kirkpatrick's levels work across various learning processes because they hit the four primary points in the learning/performance process... but he did get a few things wrong:

1. Motivation, Not Reaction

Reaction is not a good measurement as studies have shown. For example, a study shows a Century 21 trainer with some of the lowest reaction scores was responsible for the highest performance outcomes in post-training (Results) as measured by his graduates' productivity. This is not just an isolated incident—in study after study the evidence shows very little correlation between Reaction evaluations and how well people actually perform when they return to their job (Boehle, 2006).

When a learner goes through a learning process, such as an elearning course, informal learning episode, or using a job performance aid, the learner has to make a decision as to whether he or she will pay attention to it. If the goal or task is judged as important and doable, then the learner is normally motivated to engage in it (Markus, Ruvolo, 1990). However, if the task is presented as low-relevance or there is a low probability of success, then a negative effect is generated and motivation for task engagement is low. Thus it is more about motivation rather than reaction.

2. Performance, Not Behavior

As Gilbert noted, performance has two aspects: behavior being the means and its consequence being the end... and it is the consequence we are mostly concerned with.

3. Flipping it into a Better Model

The four levels are upside down as it places the two most important items last—results, and behavior, which basically imprints the importance of order in most people's head. Thus by flipping it upside down and adding the above two changes we get:

  • Result - What impact (outcome or result) will improve our business?
  • Performance - What do the employees have to perform in order to create the desired impact?
  • Learning - What knowledge, skills, and resources do they need in order to perform? (courses or classrooms are the LAST answer, see Selecting the Instructional Setting)
  • Motivation - What do they need to perceive in order to learn and perform? (Do they see a need for the desired performance?)

With a few further adjustments, it becomes both a planning and evaluation tool that can be used as a troubling-shooting heuristic (Chyung, 2008):

Revised model of Kirkpatrick's four levels of evaluation

The revised model can now be used for planning (left column) and evaluation (right column).

In addition, it aids the troubling-shooting process. For example, if you know the performers learned their skills but do not use them in the work environment, then the two more likely troublesome areas become apparent as they are normally in the cell itself (in this example, the Performance cell) or the cell to the left of it:

  • There is a process in the environment that constrains the performers from using their new skills, or
  • the initial premise that the new skills would bring about the desired change is wrong.

The diagram below shows how the evaluation processes fit together:

Learning and Work Environment

Learning and Work Environment

As the diagram shows, the Results evaluation is of the most interest to the business leaders, while the other three evaluations (performance, learning, and motivation) are essential to the learning designers for planning, evaluating, and trouble-shooting various learning processes; of course the Results evaluation is also important to them as it gives them a goal for improving the business. For more information see Formative and Summative Evaluations.

I go into more detail on my web page on Kirkpatrick is you would like more information or full references.

What are your thoughts?

1.09.2012

Visualization (Sensemaking) in Rapid Agile Learning Design

Common definitions of visualization usually read something like, “to form a mental image,” thus we often think of visualization as being a simple solo technique, such as picturing “a dog eating a bone” or “a person doing the right thing.” However in an organization context, visualization is much more complex in that while it involves an image of the working environment, it is also a complex process that is very social in nature.

The Visualization Framework

Visualization is often used interchangeably with sensemaking—making sense of the world we live and operate in, and then acting within that framework of understanding to achieve desired goals. Thus visualization is not just a shared (social) image with intent, it also implies ACTION. This framework can be used for building agile or rapid learning designs, fixing performance problems, implementing informal learning solutions, etc.

Visualization Framework

The Visualization Process

Visualization Framework (opens larger image in a new window)

The start of a visualization process is often sparked by a cue from the environment, such as an increase in customer complaints; or a team charged with improving a process. The steps within the visualization or sensemaking framework include (Leedom, McElroy, Shadrick, Lickteig, Pokorny, Haynes, Bell, 2007):

1. Triggering cues (information that acts as a signal) from the environment are perceived by the people in a Community of Interest (CoI). These cues may be picked up by one or more members of the CoI. A couple of examples of triggering cues might be an increase in the number of customer complaints or an unexpected drop in production.

2.Triggering cues create a situational anomaly—facts that do not fit into the framework of familiar mental models. Detection of these anomalies violate the expectancies of the members of the CoI and creates a need for change (improvement).

Note: A mental model is a structure or frame that is built from past experience and becomes part of an individual’s store of tacit knowledge. It is comprised of feature slots that can be instantiated by information describing a current situation (such as triggering cues). Its functional purpose allows a person to assess the situation, take a course of action, follow causal pathways, and recognize constraints in order to achieve a set of goals for actively confronting the situation. Fragmentary mental models can often be linked together to form a just-in-time explanation of a situation. Examples of a mental model include a chess player reacting to a move on the chessboard, a doctor diagnosing a medical condition, or an instructional designer solving a performance problem.

3. Specific data from the information environments trigger the mental activation of familiar mental models. The members of the CoI analyze and discuss the anomalies until they discover a purposeful structure or pattern for interpreting the new information. This transforms the problem space into various solutions. This process of “pattern matching” starts the basis for constructing new or revised mental models. Since patterns differ among the members, they collaborate by telling stories, metaphors, etc. to build common understanding.

4. Activation of a specific mental model is typically triggered by matching salient facts to one or two key features that uniquely anchor a new model that the CoI can agree upon. Tacit knowledge or intuition is often used to build mental models and the degree of tacit knowledge will vary among the members, thus they use a “negotiation process” to ensure all needs are met (or at least prioritize them according to available resources).

5. An action plan is used to instill the selected mental model into the work space in order to transform it to the desired state (during the visualization process intent must always be associated with action, otherwise it is just wistful thinking). The action plan includes the final development of any needed content, material, or products. Once all the pieces are put together, the action plan is implemented.

6. New information from the transformation process is perceived by the CoI, which in turn processes it to determine if the patterns match their desired mental model.

7. If the new information does not match the CoI's newly constructed mental model (situational anomalies are again perceived and they may or may not differ from the original ones), then the visualization process begins anew.

Probing and Shaping

While the visualization process does use passive information that derives from experience and expertise, it also involves the proactive use of shaping actions to reduce risk and uncertainty and probing actions to discover system effect opportunities that can then be exploited.

Probing develops greater understanding by experimentally testing the operational environment, such as asking questions, Cognitive Task Analysis, or immersing oneself in the troubled environment to discover new information. These probing actions help to illuminate key structures and linkages within the environment.

Shaping is taking an incentive action to discover new information in order to determine if it aids in transforming the troubled environment to meet the new mental model. Prototyping may be used as a shaping tool—an iterative process of implementing successive small-scale tests in order to permit continual design refinements. There are normally two types of prototypes:

  • Design Iteration (interpretive) — the iteration is performed to test a learning method, function, feature, etc. of the action plan to determine if it is valid.
  • Release Iteration (statistical) — the iteration is released as a product to the business unit or customer. Although it may not be fully completed or functional, the designers believe that it is good enough to be of use.

Probing actions serve to illuminate additional elements and linkages within the visualization space that can then be subsequently exploited for operational advantage.

Visualization is Dynamic, Not Static

The visualization or sensemaking framework in not linear, but rather a dynamic process that may flow in any direction, for example:

The Dynamics of Visualization

Dynamics of the visualization process

Dynamics of the Visualization Framework (opens larger image in a new window)

A Community of Interest holds a vested interests when faced with a troubling situation, thus they need a dynamic model that aids them in fulfilling their mission within complex environments. The military has a term called “center of gravity,” which is defined as the source of power that provides moral or physical strength, freedom of action, or the will to act. It is seen as the source of strength of the organization. The ability to act upon and transform an under-performing environment through the use of visualization or sensemaking is an essential attribute in an rapidly moving environment in that it helps to ensure the center of gravity stays balanced.

Reference

Leedom, D. K., McElroy, W., Shadrick, S. B., Lickteig, C., Pokorny, R. A., Haynes, J. A., Bell, J. (2007). Cognitive Task Analysis of the Battalion Level Visualization Process. Arlington, VA: United States Army Research Institute for the Behavioral and Social Sciences. Technical Report 1213. Retrieved on January 5, 2012 from http://www.hqda.army.mil/ari/pdf/TR1213.pdf